Dynamic Resource Scheduler
Whats New!
User Experience Changes
Security and Authentication
Modules and Utilities
Cyclical Scheduling - Configuration Interface
Cyclical Scheduling - Now Bulk Scheduling
Resource Quotas Improvements - Percentages
Architecture and Scheduling
Configuration
User Guides and Help
Get to Know Dynamic Resource Scheduler
How Does Dynamic Resource Scheduling Work
Speaking the Language of Scheduling
Navigating Dynamic Resource Scheduler
How your Data Links Together
Managing your Organisation
Viewing your Data
Your Customer Data
Your Service Orders
Your Jobs
Your Workers and Resources
Manage Your Tasks
Actioning your Jobs and Tasks
Job Templates
Find A Jobs Possible Workers
Locking Your Jobs
Create a Follow On Task
User Queues and Organising Your Tasks
Schedule and Organise
How to Optimise Your Scheduling
How to Schedule Manually
Scheduling Mutliple Jobs at Once
Reassign and Reschedule your Tasks
Managing Your Time and Durations
Managing your Comments and Contacts
Using Bookmarks to Drive Efficiency
Managing Your Job Status
Visualising Your Planning
Workers and Resources
Advanced Data Management
Creating Unavailability in your Workforce
Adding an Unavailability to an Individual Worker
Creating Unavailabilities for Multiple Days or Workers
Maps And Journey
Using Maps to Visualise Your Data
Using Maps With Your Data
Learn about our Closest Function
Your Journeys
Meetings and Non-Productive Planning
Administer Your Scheduler
Managing Your Organisations and Agencies
Managing Your Custom Data
Managing your Contracts
Customising Your Experience
Managing Depots and Starting Locations
Managing Diary Bookmarks
Managing your External Chart Views
KPI Settings
Managing Your Priorities
Learn about Sectors
Managing Your Follow On Templates
Get To Know Your Working Time Calendar
Managing your SOR Templates
Managing your Job Templates
Managing Your Vocabulary
Managing Your Bookmarks
Manage Your Customer Templates
Get to Know Import and Export
Managing Your Tenant Code Rules
Managing your Order Templates
Managing Your Unavailability Reasons
Get To Know Your Working Time Calendars
Managing your Worker Templates
Releases and Readiness
DRS 6, DRS 5.7 and Job Manager
User Guides and Help
Get to Know DRS
Dynamic Scheduling - How does it work
Navigating DRS
Vocabulary and Concepts
Customers
Orders
Jobs
Scheduling Jobs
Job Functions
Workers
Views
Object Inheritance
Agencies
DRS Modules
Scenario Based Planning
Managing your SMS Service
5.7 Documentation
Technical Documentation
Release Notes
DRS 6.1 Release Notes
DRS 6.1.22 - February 20, 2026
DRS 6.1.21 - September 10, 2025
DRS 6.1.20 - April 20th, 2025
DRS 6.1.19 - 11th April, 2025
DRS 6.1.18 - 13 February 2025
DRS 6.1.17 - 20th December 2024
DRS 6.1.16 - November 8th, 2024
DRS 6.1.15 - October 10th, 2024
DRS 6.1.14 - 6th September 2024
DRS 6.1.13 - 9th August 2024
DRS 6.1.12 Release Notes
DRS 6.1.11 Release Notes
DRS 6.1.10 Release Notes
DRS 6.1.9 Release Notes
DRS 6.1.8 Release Notes
DRS 6.1.7 Release Notes
DRS 6.1.6 Release Notes
DRS 6.1.5 Release Notes
DRS 6.1.4 Release Notes
DRS 6.1.3 Release Notes
DRS 6.1.2 Release Notes
DRS 6.1.1 Release Notes
DRS 6.1.0 Release Notes
DRS 6.0 Release Notes
DRS 6.0.0.0 Release Notes
DRS 6.0.0.1 Release Notes
DRS 6.0.0.2 Release Notes
DRS 6.0.0.3 Release Notes
DRS 6.0.0.4 Release Notes
DRS 6.0.0.6 Release Notes
DRS 6.0.1.0 Release Notes
DRS 6.0.1.1 Release Notes
DRS 6.0.1.2 Release Notes
DRS 6.0.1.3 Release Notes
DRS 6.0.1.4 Release Notes
DRS 6.0.1.5 Release Notes
Kirona Housing
Job Manager 9
Job Manager 9.3.0 - October 2024
Job Manager 9.1.0 - December 2022
Job Manager 9.2.0 - November 2023
Release Notes Disclaimer
Administering your Field Service Products
Supported Versions Policies
- All categories
- Dynamic Resource Scheduler
- User Guides and Help
- Maps And Journey
- Using Maps With Your Data
Using Maps With Your Data

Using Maps from the Object screens allows you to visualise the currently selected records directly within their operational context. By launching Maps from an object view, only the relevant jobs, resources, or customers in your filtered dataset are displayed, making it easier to analyse locations, identify patterns, and take action without leaving your workflow.
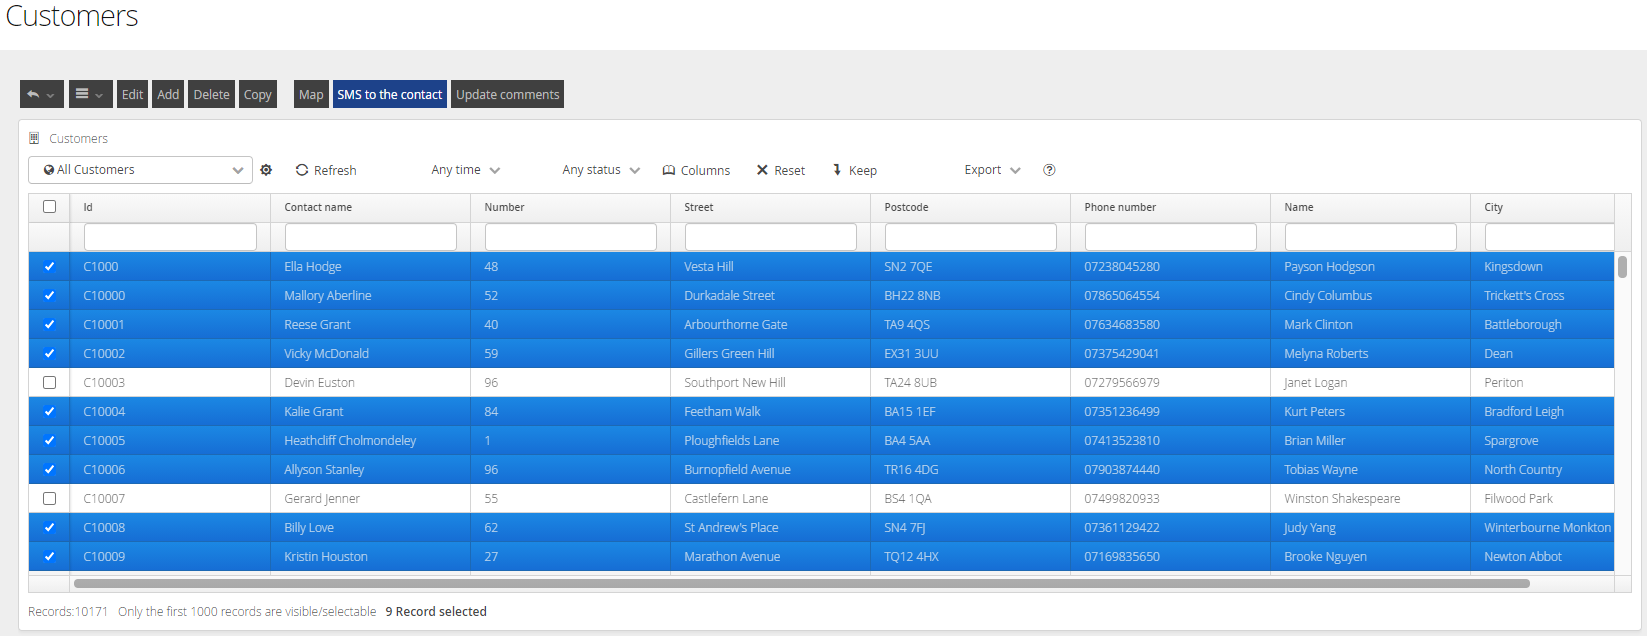
Using Maps from the Object Screens
Selecting several objects and clicking the Map button will display the Map with the items selected.
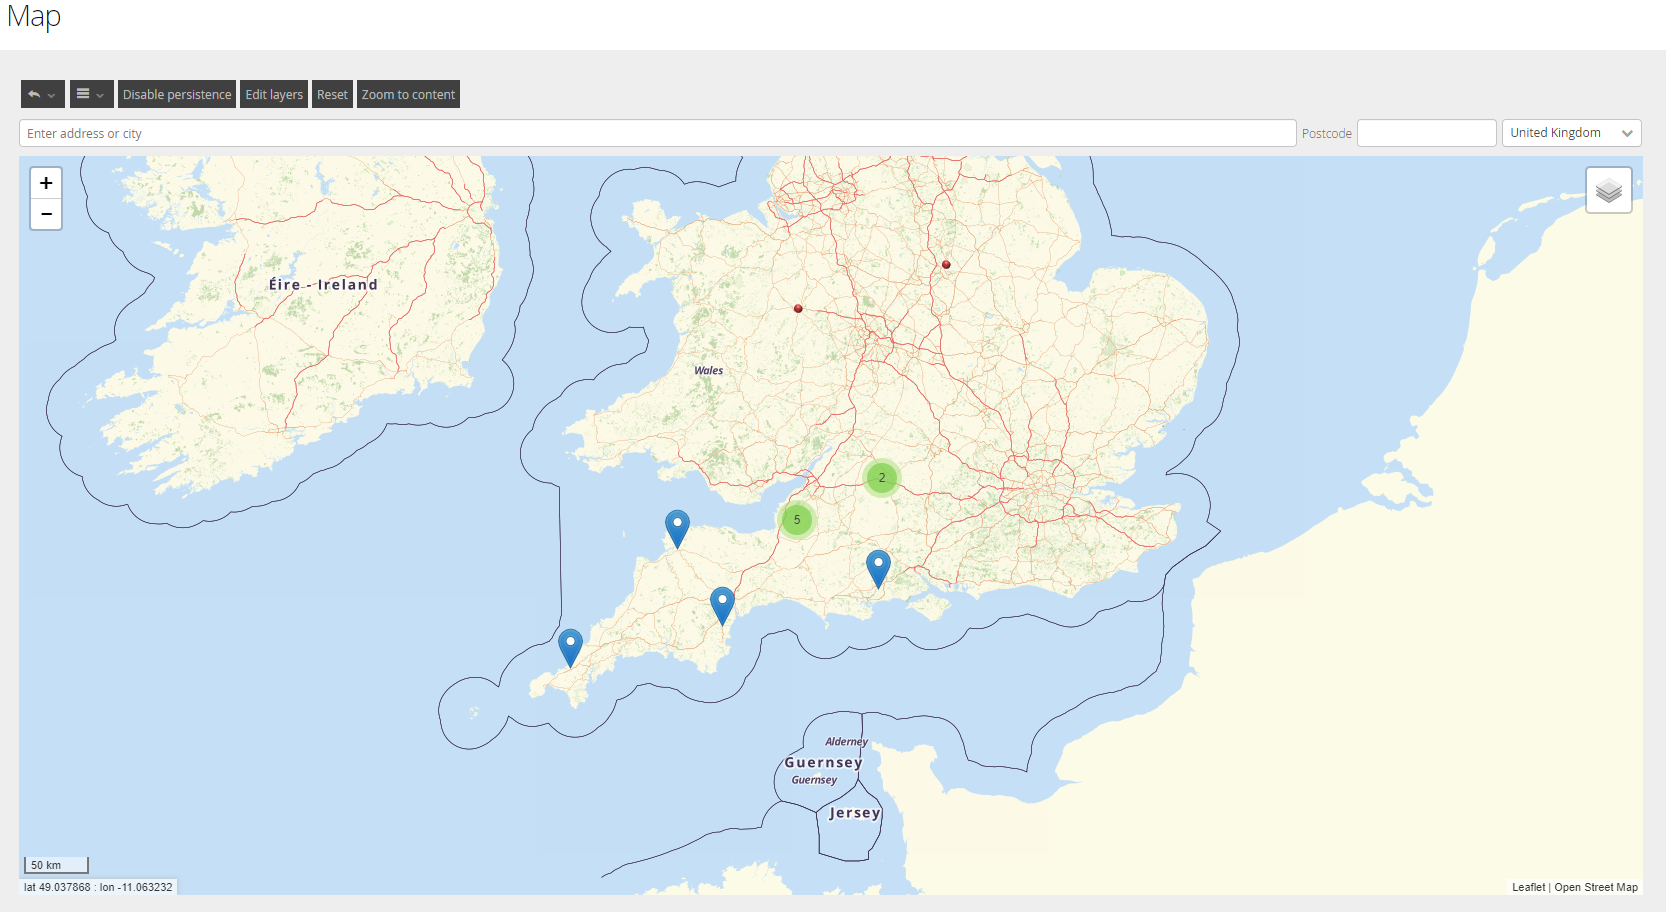
Where the items selected are close to each other on the map, they will be displayed as a consolidated icon.
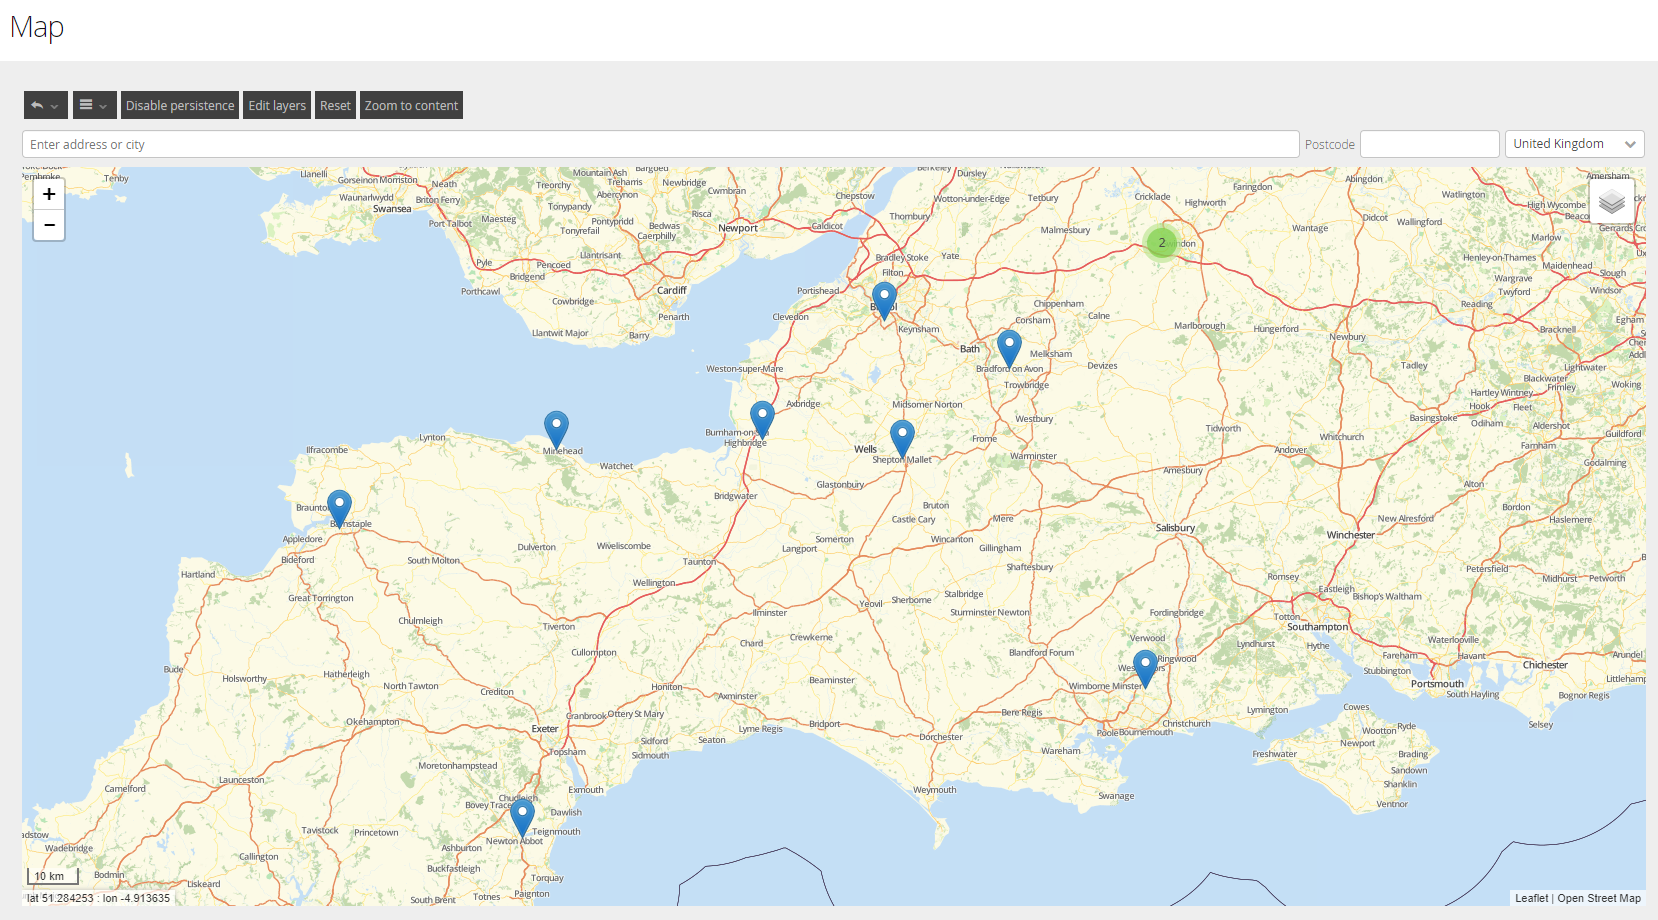
Zooming in will show these items as singular points.
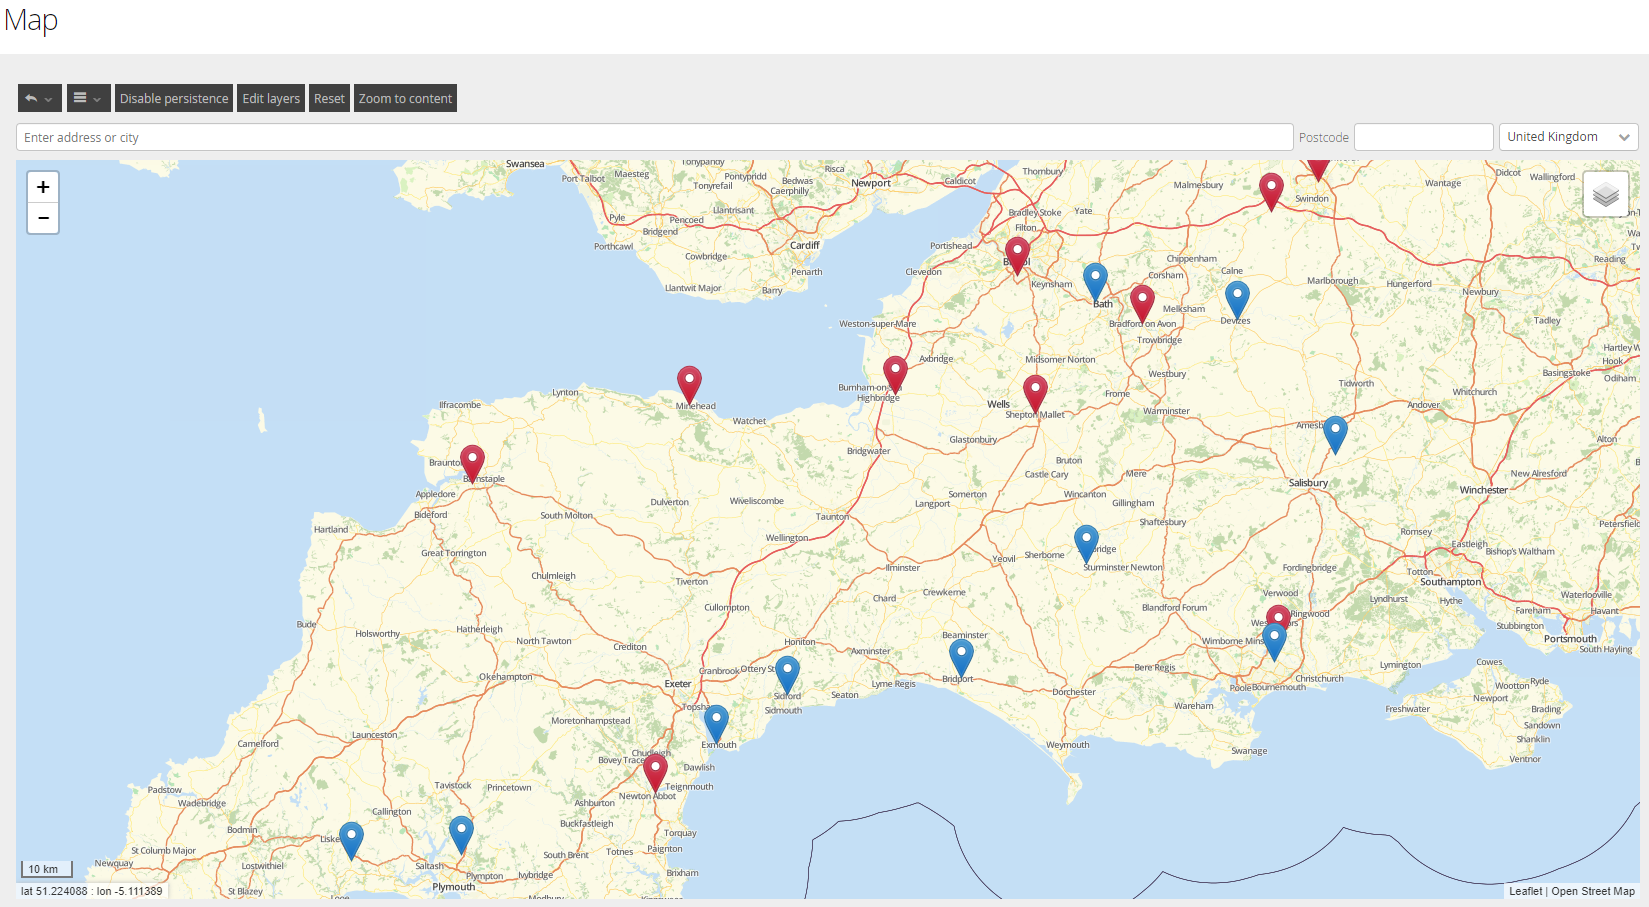
Edit Layers
Layers allow you to manage the display of your Objects on the Maps, to make your visualisations clearer. The different icon colours can be changed to identify the objects on the map. If you have set persistence, you can set different values for each layer type.
From the map screen, click Edit Layers.
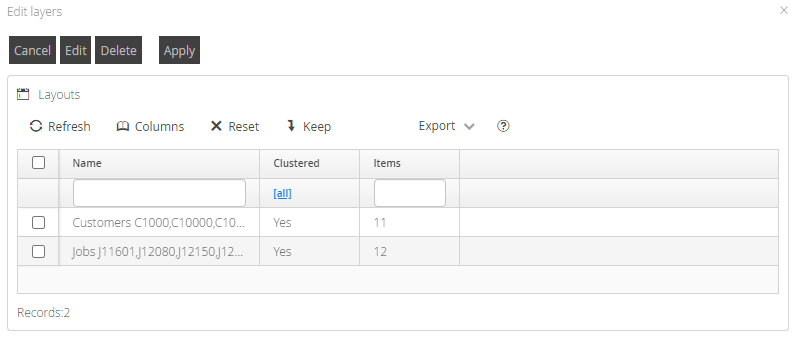
Select the layer you want to change and click Edit.
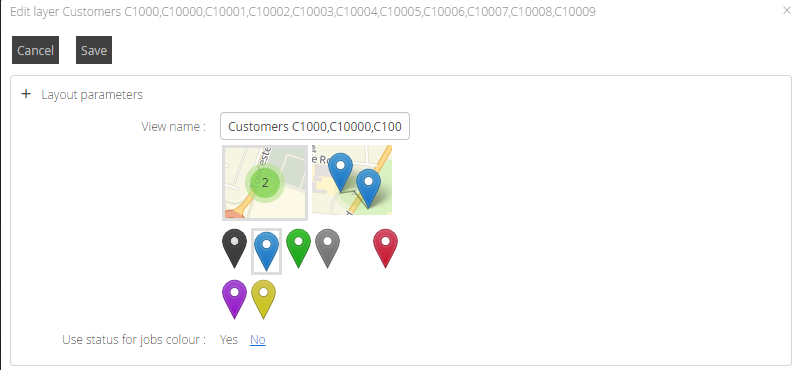
From here, you can select your Pin type and colour and then click Save and then click Apply. This will update your Map to display your changes.