Dynamic Resource Scheduler
Whats New!
User Experience Changes
Security and Authentication
Modules and Utilities
Cyclical Scheduling - Configuration Interface
Cyclical Scheduling - Now Bulk Scheduling
Resource Quotas Improvements - Percentages
Architecture and Scheduling
Configuration
User Guides and Help
Get to Know Dynamic Resource Scheduler
How Does Dynamic Resource Scheduling Work
Speaking the Language of Scheduling
Navigating Dynamic Resource Scheduler
How your Data Links Together
Managing your Organisation
Viewing your Data
Your Customer Data
Your Service Orders
Your Jobs
Your Workers and Resources
Manage Your Tasks
Actioning your Jobs and Tasks
Job Templates
Find A Jobs Possible Workers
Locking Your Jobs
Create a Follow On Task
User Queues and Organising Your Tasks
Schedule and Organise
How to Optimise Your Scheduling
How to Schedule Manually
Scheduling Mutliple Jobs at Once
Reassign and Reschedule your Tasks
Managing Your Time and Durations
Managing your Comments and Contacts
Using Bookmarks to Drive Efficiency
Managing Your Job Status
Visualising Your Planning
Workers and Resources
Advanced Data Management
Creating Unavailability in your Workforce
Adding an Unavailability to an Individual Worker
Creating Unavailabilities for Multiple Days or Workers
Maps And Journey
Using Maps to Visualise Your Data
Using Maps With Your Data
Learn about our Closest Function
Your Journeys
Meetings and Non-Productive Planning
Administer Your Scheduler
Managing Your Organisations and Agencies
Managing Your Custom Data
Managing your Contracts
Customising Your Experience
Managing Depots and Starting Locations
Managing Diary Bookmarks
Managing your External Chart Views
KPI Settings
Managing Your Priorities
Learn about Sectors
Managing Your Follow On Templates
Get To Know Your Working Time Calendar
Managing your SOR Templates
Managing your Job Templates
Managing Your Vocabulary
Managing Your Bookmarks
Manage Your Customer Templates
Get to Know Import and Export
Managing Your Tenant Code Rules
Managing your Order Templates
Managing Your Unavailability Reasons
Get To Know Your Working Time Calendars
Managing your Worker Templates
Releases and Readiness
DRS 6, DRS 5.7 and Job Manager
User Guides and Help
Get to Know DRS
Dynamic Scheduling - How does it work
Navigating DRS
Vocabulary and Concepts
Customers
Orders
Jobs
Scheduling Jobs
Job Functions
Workers
Views
Object Inheritance
Agencies
DRS Modules
Scenario Based Planning
Managing your SMS Service
5.7 Documentation
Technical Documentation
Release Notes
DRS 6.1 Release Notes
DRS 6.1.22 - February 20, 2026
DRS 6.1.21 - September 10, 2025
DRS 6.1.20 - April 20th, 2025
DRS 6.1.19 - 11th April, 2025
DRS 6.1.18 - 13 February 2025
DRS 6.1.17 - 20th December 2024
DRS 6.1.16 - November 8th, 2024
DRS 6.1.15 - October 10th, 2024
DRS 6.1.14 - 6th September 2024
DRS 6.1.13 - 9th August 2024
DRS 6.1.12 Release Notes
DRS 6.1.11 Release Notes
DRS 6.1.10 Release Notes
DRS 6.1.9 Release Notes
DRS 6.1.8 Release Notes
DRS 6.1.7 Release Notes
DRS 6.1.6 Release Notes
DRS 6.1.5 Release Notes
DRS 6.1.4 Release Notes
DRS 6.1.3 Release Notes
DRS 6.1.2 Release Notes
DRS 6.1.1 Release Notes
DRS 6.1.0 Release Notes
DRS 6.0 Release Notes
DRS 6.0.0.0 Release Notes
DRS 6.0.0.1 Release Notes
DRS 6.0.0.2 Release Notes
DRS 6.0.0.3 Release Notes
DRS 6.0.0.4 Release Notes
DRS 6.0.0.6 Release Notes
DRS 6.0.1.0 Release Notes
DRS 6.0.1.1 Release Notes
DRS 6.0.1.2 Release Notes
DRS 6.0.1.3 Release Notes
DRS 6.0.1.4 Release Notes
DRS 6.0.1.5 Release Notes
Kirona Housing
Job Manager 9
Job Manager 9.3.0 - October 2024
Job Manager 9.1.0 - December 2022
Job Manager 9.2.0 - November 2023
Release Notes Disclaimer
Administering your Field Service Products
Supported Versions Policies
- All categories
- Dynamic Resource Scheduler
- User Guides and Help
- Maps And Journey
- Using Maps to Visualise Your Data
Using Maps to Visualise Your Data

The Maps function provides a visual representation of your selected data, displaying jobs, resources, and associated locations directly on an interactive map. This allows users to quickly understand geographic distribution, track activity in real time, and make more informed scheduling or operational decisions.
Using Maps
Clicking the Map option in the Left Menu will display the Map. Any Permanent Markers configured within the Configuration tab will be displayed.
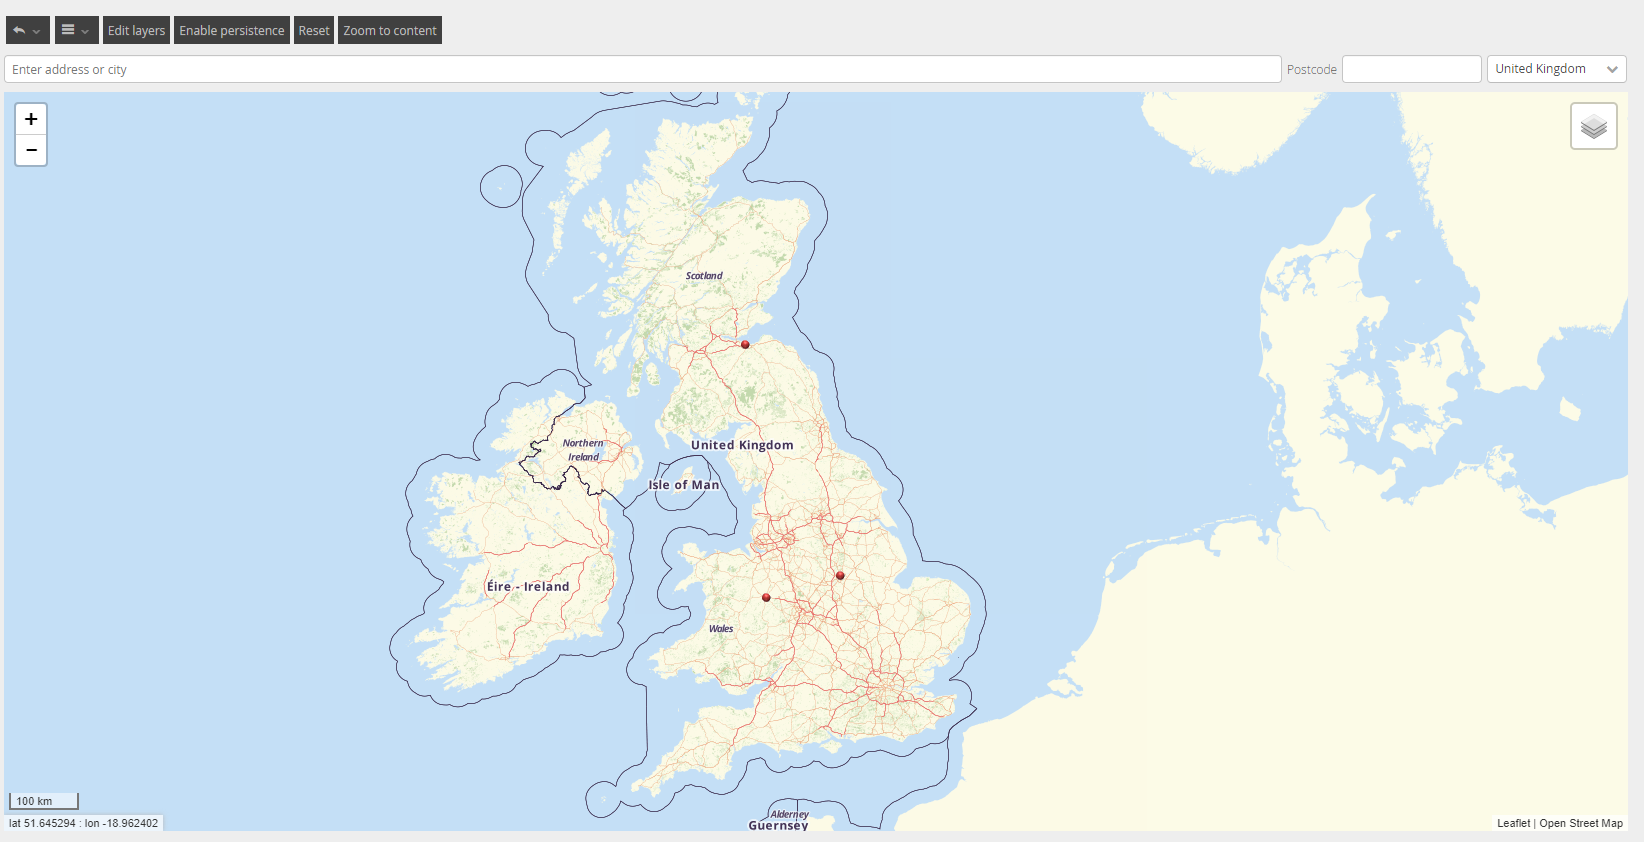
Enable Persistence
On the Map Feature throughout DRS 6.0, the Enable Persistence function can be seen. Clicking this button will result in DRS 6.0 remembering your selected Pins of each given object type currently on display.
Accessing the Map Function from another Object Type will result in your Pins from the previous session of Maps also available on display.
Reset
Using the Reset button will set your Map back to default. It will remove any persistent map icons and custom icon configuration.
Zoom to Content
Zooming can be done by clicking the +/- button or using your scroll wheel. Using the Zoom to Content button will bring your icon pins into close focus.